Restaurant-Operations-Analysis
🍽️ Case Study – Taste of the World Café
SQL & Power BI Analysis by Gouri Parvathi
Hi! I’m Gouri Parvathi, and this is my analysis project for Taste of the World Café. The goal was to assess how customers responded to a newly launched menu and to better understand ordering patterns using SQL and Power BI.
📌 Contents
- Introduction
- Problem Statement
- Table Structure
- Entity Relationship Diagram
- Case Study Objectives & Solutions
- Insights & Recommendations
- File Structure
- Dashboard Preview
- Tools Used
Introduction
In early 2024, Taste of the World Café introduced a revamped, globally inspired menu to spice up customer interest and boost revenue. The café sought to understand how well the new menu was performing, which dishes were gaining traction, and what ordering patterns could be uncovered.
With customer-level ordering data and item-level menu data available, this case study explores those trends using SQL and Power BI.
Problem Statement
Taste of the World Café wants to:
- Evaluate the performance of its updated menu
- Analyze customer ordering behavior
- Uncover insights that can inform future marketing and product decisions The café hopes to use these findings to refine its offerings, target the right customer segments, and create seasonal marketing campaigns to reduce off-peak slumps.
Table Structure
menu_items Table
| Field | Description | |—————|————————————————–| | menu_item_id | Unique ID of a menu item | | item_name | Name of the menu item | | category | Cuisine or type of dish | | price | Price of the item in US Dollars ($) |
order_details Table
| Field | Description |
|——————|————————————————–|
| order_details_id | Unique ID of an item within an order |
| order_id | Order reference ID |
| order_date | Date of the order (MM/DD/YY) |
| order_time | Time the order was placed (HH:MM:SS AM/PM) |
| item_id | Foreign key matching menu_item_id from menu_items |
Entity Relationship Diagram
menu_items ←→ order_details
(1-to-many based on menu_item_id = item_id)
Case Study Objectives
1️⃣ Explore the Menu
- Count how many items are available.
- Identify the least and most expensive dishes.
- Focus on Italian items — quantity and price range.
- Analyze each category by number of items and average price.
2️⃣ Analyze Orders
- Review the range of order dates.
- Find out how many orders and items were placed.
- Identify the largest orders based on number of items.
- Check how many orders had more than 12 items.
3️⃣ Understand Customer Behavior
- Combine order and menu data.
- Discover the most and least ordered dishes, and their categories.
- Highlight the top 5 highest-spending orders.
- Explore what made those high-spend orders unique.
Insights And Recommendations
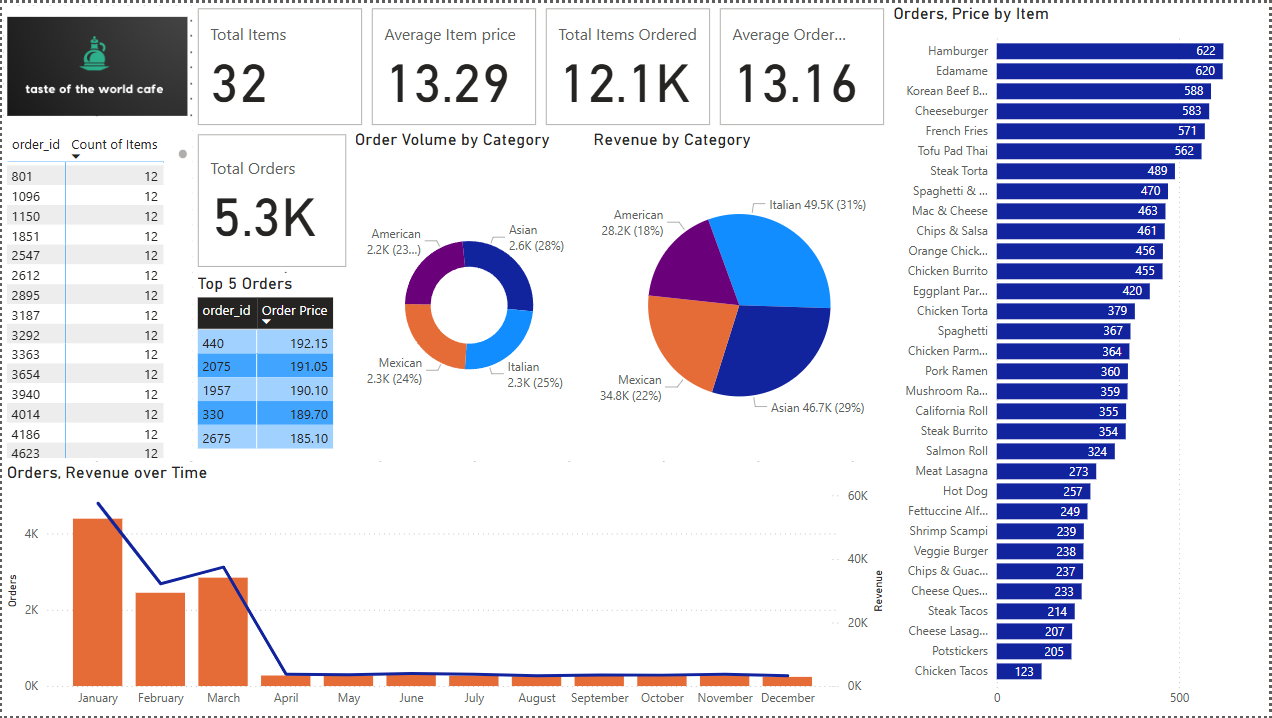
Key Findings:
- Most Expensive Item: Shrimp Scampi (Italian)
- Least Expensive Item: Edamame (Asian)
- Top Selling Item: Hamburger (American) — 622 orders (5.14%)
- Least Selling Item: Chicken Tacos (Mexican) — 123 orders (1.02%)
- Best Performing Category (Revenue): Italian (31% of total revenue)
- Least Performing Category (Revenue): American (18% of total revenue)
- Order Timing:
- January: 36.12% of orders
- February: 20.22%
- March: 23.49%
- Only ~2.2% of orders in each later month
- Average Order Value: $13.16
- Average Item Price: $13.29
- Most Popular Category (by volume): Asian (28% of orders)
- Total Orders: 5.3K
- Total Items Ordered: 12.1K
📈 Business Recommendations:
- Focus marketing around Italian dishes — they generate the highest revenue.
- Investigate why American cuisine has lower revenue despite high item popularity (Hamburger).
- Promote Chicken Tacos through discounts or bundled meals to boost its sales.
- Launch off-season promotions during months after March to boost low order volume.
- Expand Asian cuisine offerings to capitalize on its strong customer demand.
- Implement upselling strategies to increase the average order value beyond $13.16.
File Structure
📦 Restaurant-Orders/ ┣ 📜 restaurant_orders_analysis.sql ┣ 📜 README.md ┣ 📂 data/ ┃ ┗ 📄 menu_items.csv ┃ ┗ 📄 order_details.csv ┣ 📂 dashboards/ ┃ ┗ 📄 restaurant_orders.pbix ┃ ┗ 📄 dashboard_screenshot1.png ┃ ┗ 📄 dashboard_screenshot2.png
Power BI Dashboard
I’ve also created an interactive dashboard to visualize insights like top dishes, sales trends, and high-value orders.
➡️ Download the Power BI Dashboard (.pbix)
Sneak Peek:
Tools I Used
- Excel: For data cleaning and formatting
- SQL: PostgreSQL for querying and data analysis
- Power BI: For data visualization
- Git & GitHub: For version control and sharing my work